Statistics Calculator
| Mean | Median | Range | Standard Deviation | Variance |
|---|
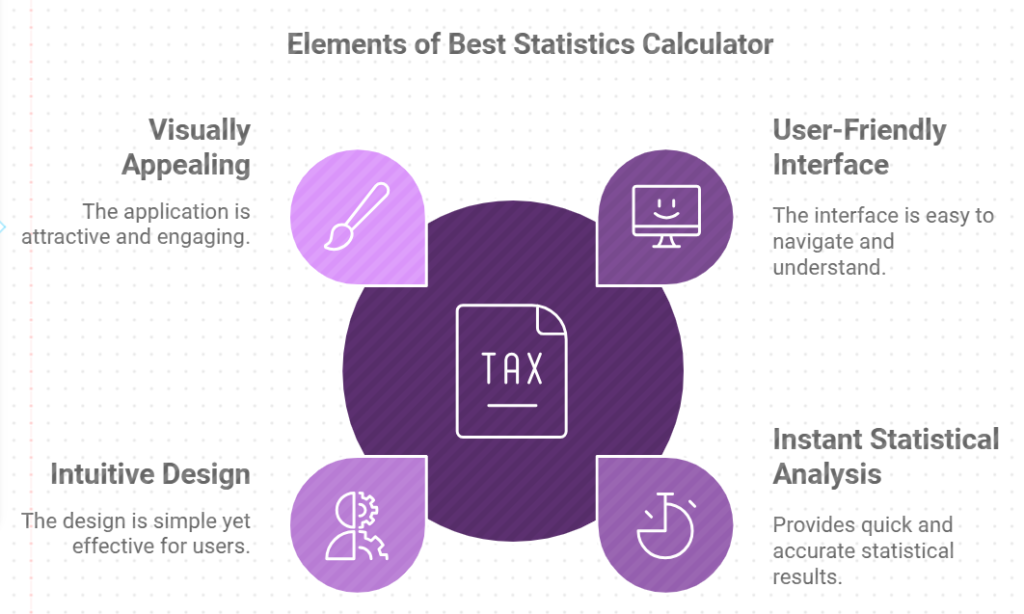
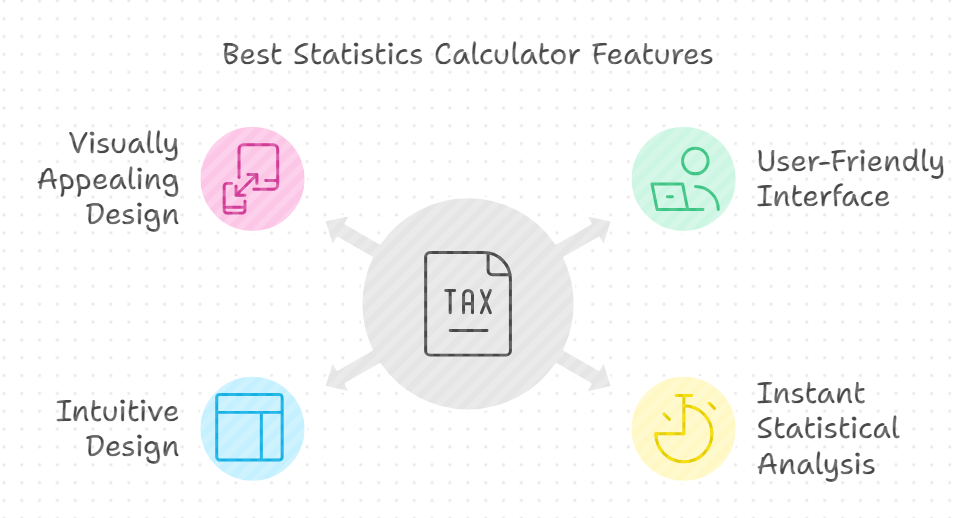
Best Statistics Calculator is a user-friendly web application that provides instant statistical analysis with an intuitive interface and visually appealing design.

Key Features and Functionality
1. User Interface
The calculator boasts a clean, modern design with a soothing color scheme dominated by whites and blues. The interface is responsive and accessible, featuring:
- A simple input field for data entry
- Clear instructions for users
- An attractive circular infographic display
- A comprehensive results table
- Smooth hover effects and transitions
2. Core Statistical Calculations
The application performs five fundamental statistical calculations:
- Mean: The average of all numbers in the dataset
- Median: The middle value when data is arranged in order
- Range: The difference between the highest and lowest values
- Standard Deviation: A measure of data spread from the mean
- Variance: The average of squared differences from the mean
3. Technical Implementation
The calculator is built using:
- HTML5 for structure
- CSS3 for styling and animations
- JavaScript for calculations and user interaction
- Modern ES6+ features for array manipulation
4. Visual Representation
The results are presented in two distinct ways:
- A circular infographic display showing the five main statistical measures
- An interactive table that highlights values on hover
How to Use
Using the Statistics Calculator is straightforward:
- Enter numerical values separated by commas in the input field
- Click the “Calculate Statistics” button
- View the results displayed both numerically and visually
Technical Details
The application includes several sophisticated JavaScript functions:
calculateMean(): Computes the arithmetic meancalculateMedian(): Determines the middle valuecalculateRange(): Finds the spread of datacalculateStandardDeviation(): Computes data dispersioncalculateVariance(): Determines data spread
Design Elements
The interface features:
- Soft shadows for depth
- Rounded corners for modern appeal
- Responsive design for all screen sizes
- Interactive elements with hover states
- A professional color scheme featuring:
- White (#ffffff) for the main background
- Blue (#3498db) for borders
- Red (#e74c3c) for the action button
- Green (#27ae60) for table headers
Benefits and Applications
This calculator is particularly useful for:
- Students learning statistics
- Researchers analyzing data sets
- Business professionals preparing reports
- Anyone needing quick statistical analysis
Future Enhancements
Potential improvements could include:
- Data visualization through graphs
- Export functionality for results
- Additional statistical calculations
- Data set storage capabilities
- Mobile app version
Conclusion
The Statistics Calculator represents a perfect blend of functionality and design, making statistical analysis accessible to users of all skill levels. Its clean interface and immediate results make it an invaluable tool for anyone working with numerical data.
Whether you’re a student studying statistics, a researcher analyzing data, or a professional preparing reports, this calculator provides a quick and reliable way to perform essential statistical calculations while presenting results in an visually appealing and understandable format.
